Bond markets struggled with rate hikes in 2022. Are they ready for what comes next?
Bond markets struggled with rate hikes in 2022. Are they ready for what comes next?
February 2023
Introduction
Inflation and the resultant tightening of monetary policy shocked investors in 2022, leading many fixed-income markets to some of their worst returns since inception. We believe that these tighter financial conditions, some recent amelioration notwithstanding, are here to stay (Figure 1).
Figure 1. Goldman Sachs Financial Conditions Indices for US and Europe
Problems loading this infographic? - Please click here
Source: Bloomberg; 31 December 2022.
The portions of the credit market sensitive to interest rates, such as investment grade, have already come under extreme pressure – as have sectors that relied on low-cost financing to survive, such as real estate (Figure 2). We will return to this point later in the article.
Figure 2. Value of Distressed Bonds and Loans by Sector
Problems loading this infographic? - Please click here
Source: Bloomberg; as of 28 December 2022.
The market seems fixated on the belief that the Federal Reserve will pivot to more accommodative policy. Eventually, without doubt – but our view is that the consensus expectation on when a pivot will occur is too optimistic. Indeed, with China re-entering world trade, inflation could remain stickier than investors think. We should, then, be prepared for an environment of elevated (or perhaps normalised) rates over the near term. The question for us is where this is likely to cause the most strain for investors.
The inflation and rate shocks of 2022 affected not only total returns in fixed income, but also the business models of many companies.
Macro Trends Become Less Supportive
The inflation and rate shocks of 2022 affected not only total returns in fixed income, but also the business models of many companies that functioned primarily through the availability of cheap funding. The velocity of the increase in rates and resultant volatility, cautious risk sentiment, and a lack of dry powder within the fund-management industry furthermore led to a dearth of new-issue supply last year. These conditions are likely to continue for the foreseeable future, and existing debt refinancings will need to compete with potential new deals to fund recent private-equity purchases.
The European leveraged-loan market may find itself in an even more precarious situation, with more than 70% of issues not hedged against a rising-rate environment as loans were issued on the presumption of perpetually low interest rates.1 The stress is not likely to end there, as the lack of covenants in loans could also lead to lower recoveries than previously experienced in this asset class. Additionally, there are other risks to note: typically weaker fundamentals, already high leverage at issuance among asset-light businesses, a quicker maturity wall (Figure 3), a greater portion in single B, and a less flexible buyer base (i.e. CLOs) in this space.
Figure 3. Maturity Profile for High Yield Bonds and Leveraged Loans, US and Europe
Problems loading this infographic? - Please click here
Source: JPMorgan and Man GLG; as of 31 January 2023.
The likely result of this scenario is an increase in the amount of stress and distress across both the high-yield and leveraged-loan spaces, with a concurrent increase in ‘amend and extend’ transactions, recapitalisations, and balance-sheet restructurings to make debt loads appropriate for the prevailing environment.
Some may take comfort from interest-coverage ratios that appear healthy now. However, we believe the trend is not our friend here as interest costs are likely to grow faster than earnings at issuers, which could lead to increased cash-burn rates over the next few years (Figure 4).
Figure 4. Loan Last 12 Months EBITDA and Interest Expense Growth, Quarter on Quarter
Problems loading this infographic? - Please click here
Source: Bloomberg, S&P Capital IQ, PitchBook LCD, Morgan Stanley Research; as of 30 September 2022.
We remain concerned about the impact of higher input prices on margins and ultimately cashflows, which could indeed turn negative for certain companies.
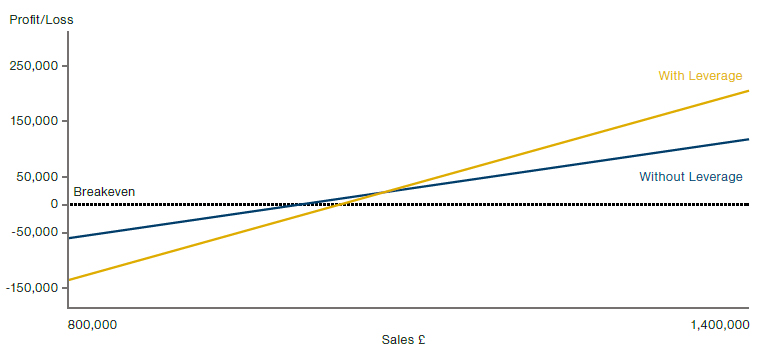
In addition, we remain concerned about the impact of higher input prices on margins and ultimately cashflows, which could indeed turn negative for certain companies. High energy prices will certainly hit cyclical industrials that rely heavily on not only energy to run factories but also on the cost of other raw materials which have been rising simultaneously. Another domino likely to fall is companies that failed to hedge against such spikes and already operate in a business with thin margins, such as those in the grocery, paper, and packaging spaces. While we may be nearing the tail end of the inflationary surge as slowing growth reduces aggregate demand and we start to become more fearful of a deflationary bust, the impact on corporations may be significant and increase the stressed opportunity set. The most operationally geared could be the most vulnerable (Figure 5). All of this could be aggravated by management teams’ post-pandemic hangover and fear of fragile supply chains, which may mean that companies hold on to employees for longer rather than reducing labour and other variable costs immediately.
Figure 5. Illustration of Impact on Lower Sales on More Operationally Geared Businesses

Source: Man GLG; as of 1 February 2023. The organisations are fictitious and are for illustrative purposes only and are not intended to be construed as a recommendation. The graphic shows that companies with leverage, all else equal, have a higher breakeven point on their sales.
We must also consider the lagged effect of tighter monetary policy: slower growth. There are few certainties in life but, with the myriad risk factors, we feel that a scenario of slowing growth and a recession as a base case would be a safe bet. Leading economic indicators are pointing to slowing output relative to potential as well as a stark deterioration in the momentum of these indicators. The consumer is in a very challenging position too, with lower discretionary income as a result of higher energy and mortgage costs, which in turn weighs on consumption. This is a recipe for slowing growth, reduced profitability and – in our opinion – more stress among cyclical industrials, autos and retail/consumer goods sectors.
This is a recipe for slowing growth, reduced profitability and – in our opinion – more stress among cyclical industrials, autos and retail/ consumer goods sectors.
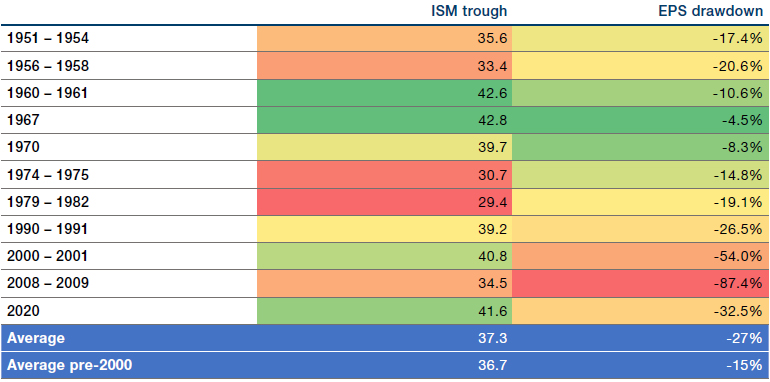
Yet despite all this, the market remains extremely complacent: S&P 500 earnings estimates for 2023 are still 3.5% above 2022.2 History suggests economic troughs are normally associated with earnings declines of 15-30% (Figure 6). For reference, the Manufacturing ISM dropped to 47.4 in January 2023 – a point lower than in December and its lowest reading since 2020.3 As this gets priced in, we believe it will create more stress and dislocations in asset prices. While we aren’t seeing any spike in default rates yet, leading indicators are sending a warning signal. The default rate is unlikely to get back to prior heights, in our view, simply due to the lack of immediate refinancing needs – although the pressure seems more acute in loans.
Figure 6. Post-War ISM Troughs Below 45 and Subsequent EPS Drawdowns

Source: National Association of Purchasing Managers, S&P Global, Bureau of Labor Statistics, Bloomberg and Man Group; as of 31 December 2022.
From Dislocation to Opportunity
As we survey the credit landscape, then, we see some of 2022’s challenges easing but new ones arising as bullish sentiment meets weakening earnings. We nevertheless expect opportunities to emerge as the consensus turns more negative and see two distinct categories.
First are the dislocated prices, where fundamentally solid credits trade at significantly discounted levels to their fundamental value. Typically, these are performing businesses whose debt securities are suffering from forced selling by constrained investors. History suggests that these assets can offer attractive returns when their spreads exceed 700 basis points (Figure 7). There was an opportunity to capitalise on these opportunities in the stress created during last year’s UK budget turmoil, and we expect more of this in other parts of the market as the retreating tide reveals all.
Figure 7. Two-Year Average Forward Returns of ICE BofAML Pan European High Yield Index by Starting Option Adjust Spread
Problems loading this infographic? - Please click here
Source: Man GLG; as of 1 February 2023. Based on full 2-year periods starting from 31 August 2010.
The second opportunity set we see is in good business models with weak balance sheets. Some companies’ capital structures are clearly poorly suited to these conditions, which gives investors the possibility of buying fundamentally sound businesses where value can be added by proactively reorganising the capital structure. This can involve providing distressed financing, restructuring the balance sheet, or potentially equitising holdings to own the business. The key is to be able to get involved within the fulcrum security within the capital structure in order to enact long-term changes. If we move further into a global recessionary environment, these types of trading situations should become more common. Such opportunities do require significant expertise, however – not just in stakeholder engagement and putting businesses onto a more sustainable financial operational footing, but across debt instruments from convertible bonds to loans.
Many large debt investors have a US bias. This can mean they overlook the diversity of the opportunity set in Europe.
Both of these types of opportunity are dependent on bottom-up analysis, but we can also discern themes at the regional and sectoral levels. Geographically, many large debt investors have a US bias. This can mean they overlook the diversity of the opportunity set in Europe. Not only is it a heterogeneous economic area, with different countries subject to different factors, but for active debtholders, Europe also offers different legal processes across its different jurisdictions. These can lead to inefficiencies in the market which are less evident in the US where Chapter 11 is a well trodden process. We also view Europe as being further along in the economic cycle, which means the region is offering more value than the US (Figure 8).
Figure 8. ICE BofAML Pan European Single B High Yield versus USD Single B High Yield
Problems loading this infographic? - Please click here
Source: Man GLG; as of 31 December 2022.
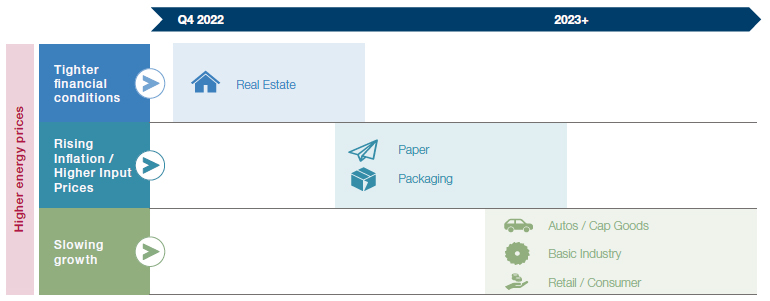
Economic conditions also favour a sequenced approach to sectoral allocations, in our view. In recent months, we have been very focused on the real-estate sector, which has borne the brunt of monetary-policy withdrawal and exhibited the quickest repricing. We believe the sector can now offer creditors very attractive situations in very asset-heavy businesses, to lend at low LTVs high in the capital structure with potentially equity-like returns. Looking further ahead, we expect rising input cost pressures to lead to a demand-driven downturn in 2023 and hit the more traditional cyclicals hardest (Figure 9).
Figure 9. Illustration of Evolution of Opportunity Set

Source: Man GLG; as of 1 February 2023. For illustrative purposes only.
Taking a more quantitative perspective on the opportunity set, the aggregate value of bonds trading below €80 increased from 0.5% of the entire universe to 35% by September 2022 before recovering to 11.9% by January 2023 (Figure 10). At the September peak, the opportunity set was vast and diverse, with over 300 issuers with an aggregate face value of €190 billion trading in stressed territory. We think the proportion of distressed issuers is likely to trend higher from here as profitability suffers and companies come under more pressure. As active managers, we expect to be in a good position to take advantage of these opportunities as they arise and can capitalise on either short-term dislocations or situations that need full-blown recapitalisations.
Figure 10. European Bonds Trading <€0.80 Cash Price
Problems loading this infographic? - Please click here
Source: Man GLG; as of 1 February 2023.
We may simply be exiting a top-down hurricane, only to step into a bottom-up tornado.
Conclusion
Overall, then, we believe any abatement of the headwinds from rate hikes and inflation should be considered in the context of the gathering headwinds that still lie ahead. 2023 will, in our view, represent the transition from a rate/inflation shock to an earnings/cashflow shock. We may simply be exiting a top-down hurricane, only to step into a bottom-up tornado. This could lead to more broad-based stress and dislocation across credit markets – and the associated opportunities for investors.
1. Source: Man GLG; as of 31 January 2023.
2. Source: Man GLG and FactSet; as of 1 February 2023.
3. Source: Institute for Supply Management; as of 1 February 2023.

You are now exiting our website
Please be aware that you are now exiting the Man Institute | Man Group website. Links to our social media pages are provided only as a reference and courtesy to our users. Man Institute | Man Group has no control over such pages, does not recommend or endorse any opinions or non-Man Institute | Man Group related information or content of such sites and makes no warranties as to their content. Man Institute | Man Group assumes no liability for non Man Institute | Man Group related information contained in social media pages. Please note that the social media sites may have different terms of use, privacy and/or security policy from Man Institute | Man Group.