Everyone loves a golden rule. Is 'sell equity when the 10-2 curve inverts' one of them?
Everyone loves a golden rule. Is 'sell equity when the 10-2 curve inverts' one of them?
October 2019
‘A generation goes, and a generation comes…All things are full of weariness…What has been is what will be, and what has been done is what will be done, and there is nothing new under the sun.'
— Ecclesiastes 1.4,8,9 (English Standard Version)
Introduction
‘This time is different’ is a dangerous phrase.
This is especially so in the case of the link between yield curve inversions and recessions, which has storied academic support, including from Man Group’s academic advisor Professor Campbell R. Harvey, who first observed the connection in 1988.1
But this hasn’t stopped people using it.
In 2000, 'this time was different' because the US was running a surplus, budget deficits were going to be a thing of the past and sovereign signals were no longer descriptive. In 2006 'this time was different' because an Asian savings glut was coming on line, causing similar distortion to the Treasury market. We don’t need to say what happened next.
This time is certainly not different as regards cries of curve denial. We’ve been making an informal count of inversion doubters since the prospect of it came on to the horizon in 2017. The list includes some illustrious names, including a former CEO of Goldman Sachs, a former Chairman of the Federal Reserve, the CIO of PIMCO and two employees of Man Group. There has even been an official Fed paper denying its importance.2 The outsized role of monetary operations, and consequent structural crushing of the term premium are the casus belli, this time around.
To be absolutely clear, we do not belong to this group: we see the curve inversion as a bad sign.
A Look at Previous Inversions
Why has the yield curve been an accurate predictor of upcoming recessions, historically?
Well, for one, it can be interpreted as the bond market saying that the cost of capital (the short end of the curve) is greater than expected economic growth (the long end) and therefore the Federal Reserve has tightened too much, meaning a recession is probable. There is also a causal link as banks, whose business models are based on being able to borrow short term to lend long term, are going to be less likely to lend. As credit creation slows, it is more likely that the economy will tip into recession.
However, what works in theory and in a spreadsheet does not necessarily stand in the coalface of practical portfolio implementation. For us, the question is not the extent to which curve inversion is ominous (which is undoubted); but instead, based on historical precedent, when the curve does invert, is there a reliable course of action an investor can profitably follow?
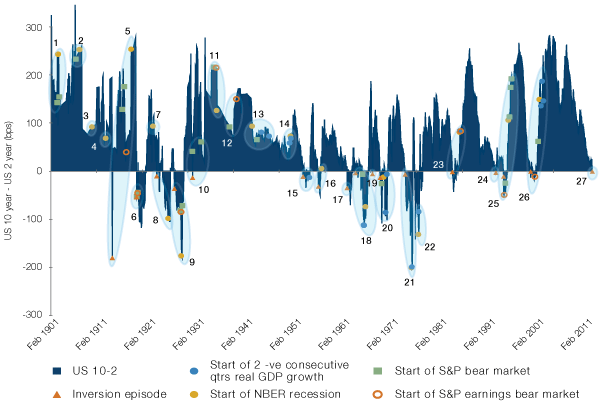
For this reason, we have recently been having a closer look at previous inversions. We have been working with the public database of US government bonds issued between 1776 and 1960, compiled by George Hall and others at Brandeis and New York Universities.3 We have combined this with data from some of our other providers to create a US 10-2 curve back to 1901, the longest such series that we are aware of.
The results are shown in Figures 1 and 2. The yellow filled circles show the start of any period defined as a recession by the NBER. The blue filled circles are the start of any period defined as a recession according to the two consecutive negative GDP quarters rule-of-thumb. The green squares are the start of any 12-month period, where US equities fell by 20% or more (a simplistic bear market definition). The red unfilled circles are the start of any 12-month period where US corporate earnings fell by 20% or more. The orange triangles show the point at which the curve first inverts, having been positive for at least six months. We have then qualitatively defined 27 ‘event clusters’, numbered and circled in grey.
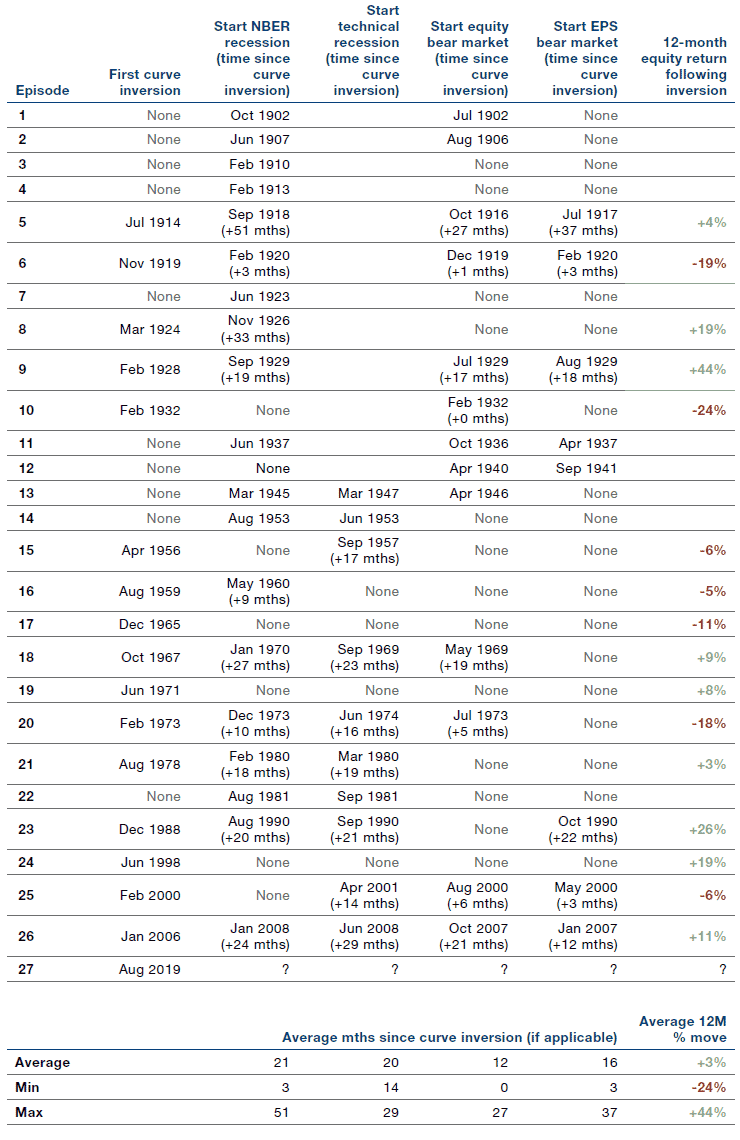
Of the 16 curve inversions excluding the current one, there were only three which did not lead to some kind of negative event, either market or economic. These were December 1965, June 1971 and June 1998.
Relevant Then, Relevant Now?
We anticipate some readers asking whether data pre-1960 can really be relevant today. To this, we would point out that the dynamics that make an inversion ominous today – cost of capital eclipsing rate of return and banks borrowing short to lend long – were also in place a century ago. Furthermore, the curve inversion has predictive power across very different regimes. Cluster number five, the first inversion in our dataset, is a good example. From the end of June to the end of July 1914, the curve dropped 374 basis points, from +194 to -180, the biggest ever monthly drop. At the long end of the curve, US Postal Savings Bonds dropped 100bp from 3.4% to 2.4% in a flight-to-safety move. On the other hand, short-term borrowing costs rocketed; rates on sterling, then the global reserve currency, catapulted from 3.0% to 8.0%. The catalyst was Archduke Franz Ferdinand and his wife, shot dead on the streets of Sarajevo on 28 June, 1914. The next four years would see a US recession, equity and earnings bear markets. The true cost, of course, was incalculable.
This serves to reiterate our previous point: curve inversions matter, they’re an economic warning, and we’re worried about the current one. But, when we start to think about the mechanics of how investors should respond to the signal, and in what timeframe, the picture becomes more complicated. As Figure 1 shows, real life is messier than can be distilled into any heuristic. In the 10 instances where an NBER recession follows a curve inversion, the gap between the two averages 22 months and ranges between three and 51 months. The NBER definitions are themselves somewhat irrelevant given the lagged release. The 2008 recession (which began in January) was declared in November – bolting horses, stable doors etc.
As multi-asset investors, what matters more to us is the link with equity bear markets in real time. Again, we see significant variability. In the eight instances where the curve inversion was followed by an equity bear market, the time between the two averaged 12 months, ranging between simultaneous and 27 months. Over the 16 inversions prior to the present, equities were positive in the subsequent year on nine occasions, and sometimes significantly so (most notably in February 1928 when they were up 44% in the following year). The average return in the 12 months following an inversion has been 3.5%.
Conclusion
In short, based on data since 1901, we find that yield curve inversions are quite reliable early signals of the end of bull markets and upcoming recessions; the lags are so variable that selling equities immediately when the inversion happens has often been wrong; but equally, ignoring and forgetting that the inversion ever happened has almost always been wrong, too. Everyone loves a golden rule, whether it’s “this time is different” or 'sell equity when the curve inverts, but reality requires rolling up one’s sleeves and considering a broader range of indicators. For us, this currently means staying overweight equities.
Figure 1. Summary Results for Episodes as Defined in Figure 2

Figure 2. The US 10-2 Curve Since 1901

To construct the 2-year yield prior to 1965, we take individual bonds with maturities between 1-3 years from US Federal Debt 1776-1960: Quantities and Prices (George Hall, Jonathan Payne and Thomas Sargent). Where no bond exists in a particular month, the benchmark yield is assumed to move with the same magnitude as the Fed Funds rate, and the BoE base rate prior to 1920. For the 10-year yield we use Professor Shiller’s dataset. Other sources: Bloomberg, Minack Advisors, Federal Reserve, BoE.
1. Campbell Harvey – The Real Term Structure and Consumption Growth – Journal of Financial Economics 22 – 1988.
3. George Hall, Jonathan Payne and Thomas Sargent – US Federal Debt 1776-1960: Quantities and Prices – Brandeis / New York Universities – September 2018.
You are now exiting our website
Please be aware that you are now exiting the Man Institute | Man Group website. Links to our social media pages are provided only as a reference and courtesy to our users. Man Institute | Man Group has no control over such pages, does not recommend or endorse any opinions or non-Man Institute | Man Group related information or content of such sites and makes no warranties as to their content. Man Institute | Man Group assumes no liability for non Man Institute | Man Group related information contained in social media pages. Please note that the social media sites may have different terms of use, privacy and/or security policy from Man Institute | Man Group.