Emerging-market corporate debt is a morality tale in reverse – it appears to be a beautiful swan but is, in reality, an ugly duckling.
Emerging-market corporate debt is a morality tale in reverse – it appears to be a beautiful swan but is, in reality, an ugly duckling.
June 2021
Introduction
If you were told there was a fixed income asset out there that: (a) could protect you in a higher rate environment; (b) has lower volatility than the risk-free asset (US Treasuries); and (c) offers a yield that’s 250 basis points higher than comparable US Treasuries, you’d be rushing to invest in this product.
The fixed income asset in question does exist and it is called emerging-market corporate debt (EMD corporates). Indeed, there has been high demand for the asset class based on recent flow and positioning data. This begs the question: is the EMD corporate asset class as wonderful as it appears, or is there a catch?
By the end of this article, we believe the reader may come to realise that EMD corporates is a morality tale in reverse – it appears to be a beautiful swan but is, in reality, an ugly duckling.
Lies, Damned Lies and Statistics
One of the favourable features of EMD corporates touted by investors is its historical negative correlation to UST yields. Because of this, they believe that EMD corporate spreads would compress enough to offer some level of protection in a rising rate environment.
There is some truth to this argument. Figure 1 shows the correlation between spreads in various fixed income asset classes and the US 10-year Treasury yield. In every time horizon, the EMBIG Diversified and CEMBI BD indices (which tracks US dollar-denominated bonds issued by EM corporates) have exhibited a negative correlation to US Treasuries.
Figure 1. Weekly Correlation between US 10-Year Yields and Other Fixed Income Asset Classes

Source: Bloomberg; as of 28 April 2021.
These correlations correspond to long periods of time and hence smoothes out the data. Additionally, the correlation analysis corresponds to changes in spread, not yield.
However, these correlations correspond to long periods of time and hence smoothes out the data. Additionally, the correlation analysis corresponds to changes in spread, not yield. A better analysis, in our view, would be to see how the CEMBI BD yield performs in periods of sudden upticks in US Treasury yields.
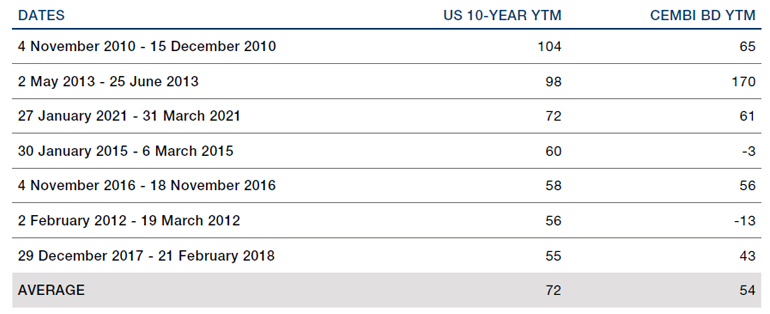
Figure 2 shows the change in yield of the CEMBI BD when UST yields moved higher by 50 basis points or more in a relatively short time horizon (1.5 months or less). There have been seven such episodes in the post-Global Financial Crisis (‘GFC’) era. There have been only two instances out of those seven where yields actually tightened – in all the other periods, CEMBI BD yields widened materially in sympathy with the move in US Treasuries. The average CEMBI BD yield increase was 53 bps in those seven instances versus an average US Treasury yield move of 70 bps. Or to put it another way, CEMBI BD yields captured 75% of the up move in US Treasury yields.
So yes, CEMBI BD spreads exhibited negative correlation to the move of US Treasuries in these episodes, but that’s small consolation when the investor still experiences capital losses from the 75% capture in yield terms.
Figure 2. Changes in Yield: US Treasuries Versus CEMBI BD
Source: Bloomberg; as of 30 April 2021.
Yes, the yield is compelling at first blush. However, the shine comes off quickly when factoring in the deteriorating fundamentals and rich valuations.
The Road to Hell Is Paved With Carry
Some readers may be quick to dismiss the argument from the prior section, as they may not believe we are headed for a higher rate world. Instead, they would argue that we will be in a ‘lower for longer’ environment where central banks remain accommodative and any inflation scare is transitory. Investors who hold these beliefs are drawn to anything with a semblance of carry-like moths to fire.
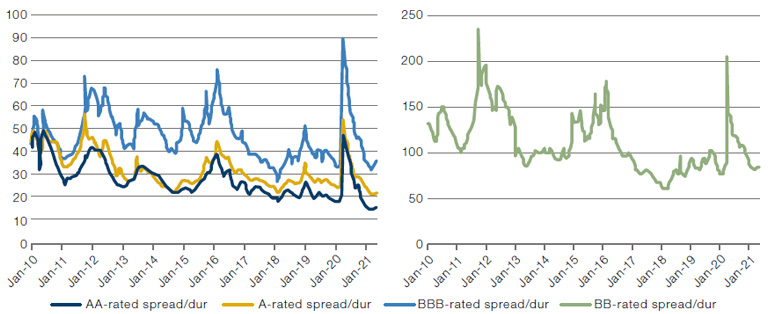
And on that front, EM corporate bonds certainly delivers. The CEMBI BD index offers a spread of 253 bps over US Treasuries1, which on the surface, appears to be an attractive level for an index whose average rating is BBB-. However, a look under the hood reveals some mechanical problems. Figure 3 shows spread per turn of duration by credit rating. We show it in this fashion so that we have an apples-to-apples comparison as duration has fluctuated over time and the credit quality at the overall index level has changed as well (more on that later).
Figure 3. Credit Spread Per Turn of Duration
Source: Bloomberg; as of 30 April 2021.
It is quite evident that we are at very expensive levels when looking at it from this lens. AA-rated and A-rated names are at their most expensive levels post-GFC while BBB-rated and BB-rated names are close to it. When these metrics had reached similar levels in the past, it was followed by sell-offs.
We show this metric by credit rating to cut off the counterargument of: “well, maybe these valuations are justified by better fundamentals”. But let’s play out that argument – maybe the tighter valuations coincides with improved fundamentals.
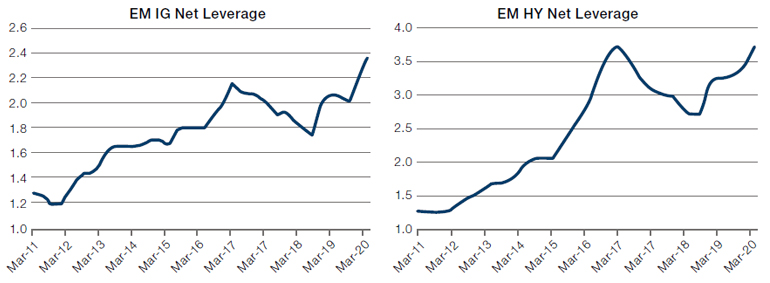
Figure 4 shows net leverage of EM corporates by credit rating.2 As illustrated, net leverage for both investment grade (‘IG’) and high yield (‘HY’) names have increased materially over the past several years.
Figure 4. Net Leverage by Credit Rating
Source: Bloomberg; as of 30 April 2021.
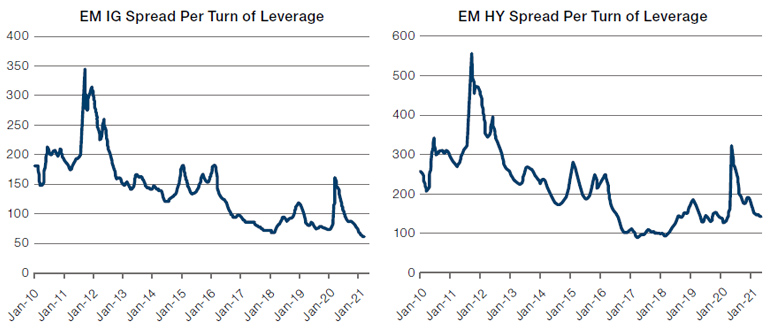
And when we look at EM corporate spread per turn of leverage (Figure 5), we can see that we are at the lowest level in the post-GFC era for IG and close to the lows for HY, consistent with the valuation shown by the spread/duration analysis.
Figure 5. Spread Per Turn of Leverage
Source: Bloomberg; as of 30 April 2021.
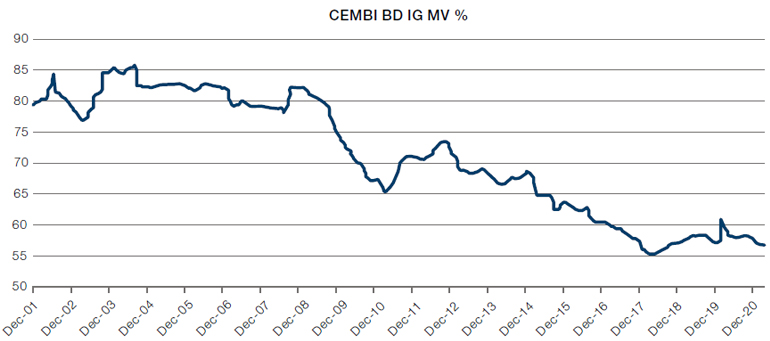
An even simpler way of highlighting the deteriorating fundamentals is by looking at the evolution of the IG weighting in the CEMBI BD (Figure 6). The index has gone from a peak of 86% IG to 57% today, close to the all-time low. So yes, the yield is compelling at first blush. However, the shine comes off quickly when factoring in the deteriorating fundamentals and rich valuations.
Figure 6. IG Weighting of CEMBI BD Index
Source: Bloomberg; as of 30 April 2021.
So Why Are Investors Flocking to Such a Lemon?
The easiest answer? Investors love the carry trade and don’t really care to hear about or understand the valuations or fundamental side of the story.
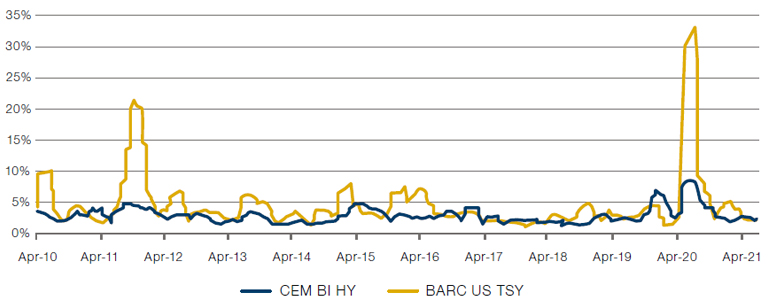
An investor needs two elements for a successful carry trade: high carry and low volatility. We already discussed the carry aspect for EMD corporates; Figure 7 shows the volatility angle. The yellow line is the realised rolling 3-month volatility of the HY portion of the CEMBI BD index and the blue line is the rolling volatility of the Barclays US Treasury Total Return Index. Note that HY corporates are quoted off US Treasuries. Even though EMD HY corporates are the riskiest segment of the EMD universe and US Treasuries are the safe haven of the world, HY corporates traded with less volatility than the risk-free asset for essentially four years prior to the Covid-induced selloff!
This carry trade, just like every other carry trade, comes with a warning: buckle your seat belt, the ride may get bumpy.
This was due to the illiquidity of the HY space that fed the illusion of low volatility as no one needed to sell these bonds during this time period. To illustrate the illiquid nature of EM corporates: TRACE data shows that of the 700+ EMD corporate issuers it tracks trading volume for, only 20 issuers had daily trading volume above USD10 million over the past 50 days.3 The problem with the illiquidity is not when investors are adding to their longs like they did from 2016 to February 2020, but rather when they are forced to liquidate their positions like they did in March 2020. You can see how quickly and severely volatility spiked higher during that time.
This carry trade, just like every other carry trade, comes with a warning: buckle your seat belt, the ride may get bumpy.
Figure 7. 3-Month Rolling Volatility of EM HY Corporate Bonds Versus US Treasuries
Source: Bloomberg; as of 30 April 2021.
The Carriage Turns Into a Pumpkin
As mentioned in the introduction, it appears that the EMD corporates asset class isn’t quite what it appeared to be.
Today is not the time and place to be overly aggressive in allocating to EMD corporates when one isn’t being properly compensated for the risk.
Should the reader conclude then that there are no merits at all to investing in EMD corporates? By no means – there is always a place in an investor’s portfolio for an asset class that has grown tremendously over the years, especially one that is truly diversified (the CEMBI BD index has over 750 issuers representing 60 countries).
Rather, the argument we make here is that today is not the time and place to be overly aggressive in allocating to EMD corporates when one isn’t being properly compensated for the risk. When one does invest, it’s best to either stick to the most liquid corporate issuers and/or invest via a vehicle with a sufficient lock-up period (i.e., not daily liquidity) to offset the illiquid nature of the asset class. If and when there is the inevitable next sell-off, that will present a prime opportunity to invest in this space, when the value an investor can receive is true gold instead of fool’s gold.
1. As of 30 April, 2021.
2. This data is compiled by Bank of America – as such, the composition of corporates may be different from the JP Morgan CEMBI BD index.
3. As of 30 April, 2021.
You are now exiting our website
Please be aware that you are now exiting the Man Institute | Man Group website. Links to our social media pages are provided only as a reference and courtesy to our users. Man Institute | Man Group has no control over such pages, does not recommend or endorse any opinions or non-Man Institute | Man Group related information or content of such sites and makes no warranties as to their content. Man Institute | Man Group assumes no liability for non Man Institute | Man Group related information contained in social media pages. Please note that the social media sites may have different terms of use, privacy and/or security policy from Man Institute | Man Group.