You may not be interested in the term premium, but the term premium is interested in you(r portfolio)
You may not be interested in the term premium, but the term premium is interested in you(r portfolio)
July 2024
The New York Fed, guardians of the term premium as most people think about it (the Adrian, Crump and Moench (‘ACM’) model), states the following1 (emphasis mine):
“…yields on Treasury securities are composed of two components: expectations of the future path of short-term Treasury yields and the Treasury term premium. The term premium is defined as the compensation that investors require for bearing the risk that interest rates may change over the life of the bond. Since the term premium is not directly observable, it must be estimated, most often from financial and macroeconomic variables…”
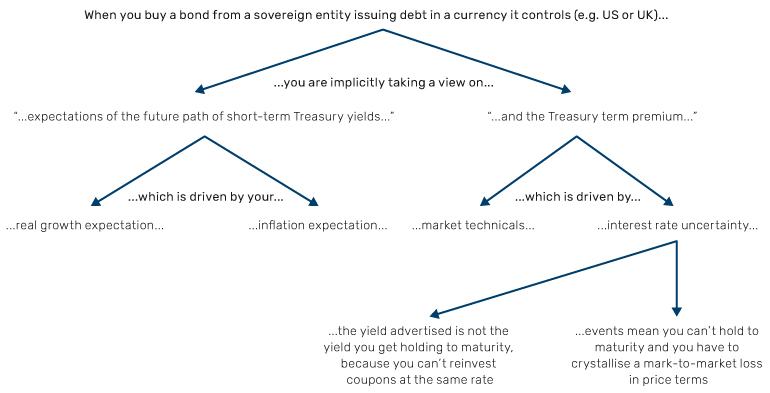
I have hesitations around ACM, which I’ll come back to. But the above is as sensible a definition as any. Here’s a schematic cueing off that starting point:
Figure 1: A decomposition for drivers of sovereign bond performance

Our interest is in the right-hand branch. ‘Market technicals’ refers to non-fundamental factors. An example might be that a certain maturity may have utility outside of pure returns, immunising liabilities in an asset and liability management (ALM) framework, for instance.
This will be minor. The real meat comes in the other branch, ‘interest rate uncertainty’. This has two elements.
Firstly, the risk that you have to hold the security to maturity, but that the term structure changes as you do. The key assumption you make when using yield-to-maturity (YTM) as a proxy for prospective return is that you can reinvest coupons at the interest rate which prevailed when the security was bought. At time of writing, the May 2034 US treasury (UST) is available at a YTM of 4.45%. Imagine you buy this bond and immediately afterward there’s a recession, yields fall 300bps and stay there for the remainder of the instrument’s life. In the short term you’d have an attractive unrealised gain, but assuming you HAD to hold to maturity, the return you would feel would not be 4.45% but 3.94%.
Secondly, consider an opposite scenario. Rather than a recession, you face a resurgence in inflation immediately after purchase. Yields rise 300bps and stay there for the remainder of the instrument’s life. If you were able to hold to maturity, your realised annual return come May 2034 would be 5.02%, higher than what was ‘advertised’ at purchase, and you’d be sitting pretty, at least in nominal terms. But imagine that you suddenly needed the money, in liquid form, right after the inflationary surge. Let’s say your root canal flares up and you don’t want to try your hand at amateur dentistry.
You would immediately crystallise a paper loss of some 24% which, if you could have held out, would have reversed as the bond pulled to par. Stretched over 10 years, your felt return would not be +5.02%, nor +4.45% but -2.73%.
Bond maths tutorial over. The uncertainty around the path of rates has real economic impact. Put another way, do not overlook the ‘real life’ benefit of liquidity.
Now back to the ACM model for estimating the term premium. I won’t try and explain how they calculate it because, even after reading the paper, I’m none the wiser2. I did, however, pick up that they also believe it is driven, in the main, by uncertainty around future rates. They cite the MOVE Index as a proxy for that uncertainty. Here’s a chart:
Problems loading this infographic? - Please click here
There was a relationship between the two until about 2013, conveniently when the paper was published, but since then it has broken down. Current levels of implied bond volatility (MOVE around 100) would imply a 10Y term premium of ~140bps, not -20, as currently measured by ACM. If this relationship reverted to precedent (via the term premium rising rather than MOVE falling) that would already imply a -13% return for 10Y paper, keeping growth and inflation expectations constant. But I think there are good reasons for thinking that the premium could be higher still.
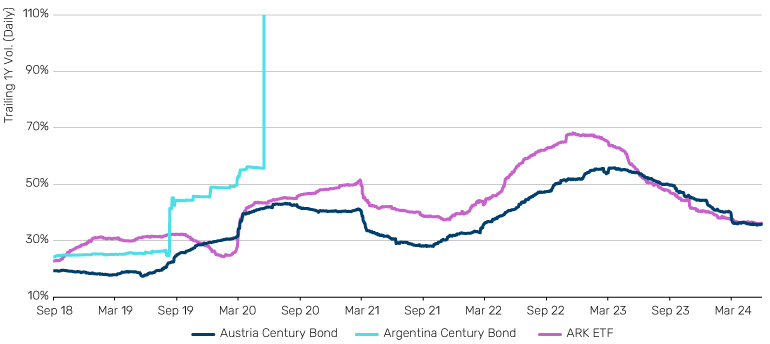
Here's why. Go back to the NY Fed definition we started with. At the end, it makes the point that the term premium ‘is not directly observable’. Like love and gravity, it must be intuited from how it affects objects around it. Here’s one (I think) intuitive way to do that. Exhibit 3 shows volatility of two 100-year maturity bonds, as well as that of ARK ETF, Cathie Wood’s hated and feted technology fund.
Figure 3: Volatility, Selected Assets

Source: Bloomberg, Man Group calculations.
Why century bonds? Well over that timeframe it seems unlikely that changes in growth or inflation expectations (per the left-hand branch of Figure 1) are going to have much bearing on price moves. I start falling asleep when I get a GDP forecast for 2030, let alone 2120. The term premium should dominate how these instruments behave. They therefore represent useful sensors to pick up the impact of that which is invisible to the naked eye.
Volatility in Argentina’s 100-year bond has moved. But that has nothing to do with the term premium. The country went bust in 2020, meaning volatility went to many thousands of percent very quickly, and has been zero ever since. It violates the first premise of Figure 1, in that the bonds were issued in USD.
Austria isn’t issuing in its own currency either, let’s be clear, but if we take the EU at their word on ever closer integration, it’s the next best thing. This too has moved, albeit not as dramatically, its volatility roughly doubling from 15% to a little over 30% in 5 years. I’ll be frank, I don’t think this is nearly enough. Consider these charts:
Problems loading this infographic? - Please click here
I implied earlier that it takes supreme chutzpah to predict growth and inflation out a hundred years. *Cracks knuckles*. No, I won’t go there, but here is a factual statement, attested by Figure 4: since 1970 the minimum to median range of annualised real growth experienced in the lifetime of a European dying at 100 is between 1.8% and 2.9%. The same for inflation is 1.0% to 5.5%. Now, fair enough, the latter figure is skewed by some apocalyptically large individual years, the 105,709,670,324% price rise that the Weimar Republic experienced in 1923 chief among them. But then again, 100 years is quite a long time.
Let’s be conservative and take the average of the minimums through time (in other words the average of the navy blue lines in Figure 4). This gives us 1.9% growth and 2.1% inflation. So, 4% nominal growth. Austria’s 2120 bond issued in June 2020, garnered a yield of 0.9%. Back of a fag packet that’s a NEGATIVE term premium of -310bps. To be clear that means you are paying for the privilege of taking term risk. Today, the same bond is yours for a yield of 2.4%. If we’re still running with the 4% estimate of nominal growth, that implies -160bps. A moderation, but you’re still paying.
Admittedly, this is in the category of ‘does it feel right?’ observations. For me -20 for 10 years (per the ACM estimate) feels wrong. -160 over 100 feels very wrong. Should you really pay to take on illiquidity?
A final point. Back to Figure 3. Why include ARK ETF? To illustrate that the move in its volatility has been similar to the Austria bond. The estimated term premium getting revised higher is explicit bad news for bonds, because yields will rise absent moves down in expected growth and inflation. But it is also implicitly bad news for segments of the equity market which trade with a price action reminiscent of ultra long-term duration.
That’s it. Did I hold your interest? I hope so. To paraphrase Trotsky, you may not be interested in the term premium, but the term premium is interested in you(r portfolio).
1. When most people think about the term premium quantitatively they are referring to the Adrian, Crump and Moench estimate. Bloomberg ticker ACMTP10 Index for the 10 year iteration. This definition at the following link: https://www.newyorkfed.org/research/data_indicators/term-premia-tabs#/overview
2. Available here: https://www.newyorkfed.org/medialibrary/media/research/staff_reports/sr340.pdf%20ifif you want to have a go yourself.
You are now exiting our website
Please be aware that you are now exiting the Man Institute | Man Group website. Links to our social media pages are provided only as a reference and courtesy to our users. Man Institute | Man Group has no control over such pages, does not recommend or endorse any opinions or non-Man Institute | Man Group related information or content of such sites and makes no warranties as to their content. Man Institute | Man Group assumes no liability for non Man Institute | Man Group related information contained in social media pages. Please note that the social media sites may have different terms of use, privacy and/or security policy from Man Institute | Man Group.