How should investors reposition their portfolios in the face of heightened inflation risk?
How should investors reposition their portfolios in the face of heightened inflation risk?
May 2021
Introduction
Inflation risk has increased. However, over the past three decades, a sustained surge in inflation has been absent in developed markets. As a result, investors are faced with the challenge of having little evidence regarding how to reposition their portfolios in the face of heighted risk.
Rather than predicting when (or if) inflation will increase to disruptive levels, we aim to answer a simpler question: what passive and dynamic investments have historically tended to do well (or poorly) in environments of high and rising inflation?
Why Does Inflation Matter for Asset Prices?
Treasury bond prices are obviously impacted by unexpected inflation. Their current prices reflect an expected real interest rate, an expected rate of inflation and risk premium. If there is an unexpected surge in inflation, the expected inflation embedded in the yield increases and the bond price usually falls. If the new level of expected inflation is long lasting, bonds with higher durations will be more sensitive than those with shorter duration bonds. A change in the uncertainty about inflation rates may also impact the risk premium.
Equities are more complicated. First, higher and more volatile inflation creates more economic uncertainty, thus harming the ability of companies to plan, invest, grow and engage in longer-term contracts. Moreover, while firms with market power can increase their output prices to nullify the impact of an inflation surprise, many companies can pass on the increased cost of raw materials only partially. Margins therefore shrink. Second, unexpected inflation may be associated with future economic weakness. While an overheating may cause companies’ revenues to increase in the short term, if the inflation is followed by economic weakness, it will decrease expected future cash flows. Third, there is a tax implication for companies with high capital expenditures because depreciation is not indexed to inflation. Fourth, unexpected inflation could serve to increase risk premiums (increase discount rates) reducing equity prices. Finally, similar to bond markets, high-duration stocks (particularly growth stocks that promise dividends far in the future) are especially sensitive to increased discount rates.
The inflation mechanism for commodities, like bonds, is relatively straightforward. Indeed, commodities are often a source of inflation.
Defining Inflationary Regimes
We are interested in episodes where the speed AND the acceleration in price rises are both high; in other words, where the rate of year-over-year inflation is elevated and rising. Such environments are the most sensitive for the effects we have described above.
Thus, we define inflationary regimes as time periods where the year-on-year realised inflation rate rises materially beyond 2%. Today, this level is often targeted by central banks across the world and, even when not explicit, is considered a psychologically important threshold. For instance, James Bullard, President of the Federal Reserve Bank of St. Louis, has described the 2% target as an “international standard”. We define ‘materially beyond 2%’ as reaching 5% or more. Our definition yields the eight US inflation regimes shaded grey in Exhibit 1. To assemble a critical mass of evidence, we use data from 1926 across three continents.
Problems loading this infographic? - Please click here
Source: Man Group, National Bureau of Economic Research; as of 1926-March 2021.
Note: The red rectangles at the bottom of the chart are periods where the US economy was in recession as defined by the National Bureau of Economic Research.
Main Results
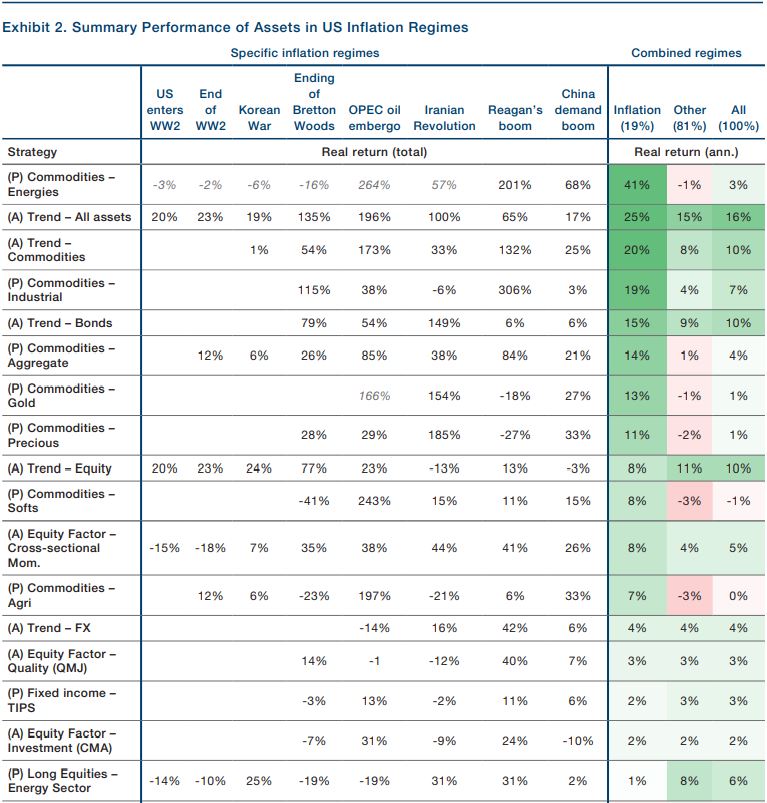
In Exhibit 2, we show a summary of how a selection of assets perform through the eight US inflation regimes. For a more detailed look at other assets and geographies, readers are directed to peruse the full academic paper, The Best Strategies for Inflationary Times, which can be downloaded for free.
In what follows we provide some brief comments on some of the key results.
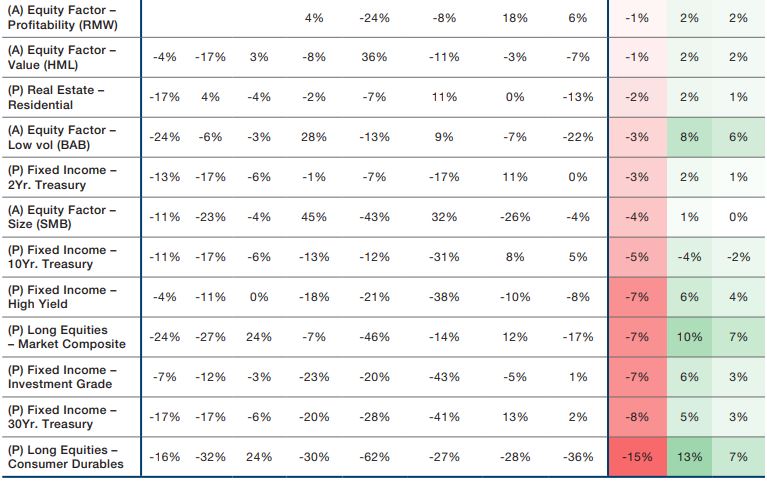
Equites do poorly during inflation surges. The inflation adjusted or real return on equities is -7% on an annualised basis.
Bond investors are also punished during inflationary surges with a -5% annualised real return for the US 10-year Treasury bond. The longer maturity bonds to even worse.
Consequently, the 60-40 equity-bond portfolio disappoints during inflationary regimes, with-6% real annualised return.
Commodities are an inflation winner amongst passive strategies over our 95-year sample. In aggregate, they produced a 14% real annualised return during our inflation regimes, compared with just 1% in normal times. However, our analysis shows there is considerable variation amongst the different commodity components.
US residential real estate has a small negative annualised real return of -2% during inflationary regimes, while it is +2% at other times. So, the asset does not seem to vary much during times of inflation, unlike commodities.
Collectibles, and in particular art, wine, and stamps, have lived up to their reputation as a store of value in inflationary times. Real returns are positive for all three assets, with art at +7%, wine at +5% and stamps returning +9%.
With active equity strategies, smaller companies underperform in inflationary regimes. In real terms, the premium for being long small companies and short large companies is -4% a year in inflationary periods, compared with +1% in normal times. This fits with intuition. Economies of scale are important in mitigating the costs of inflation. The Profitability and Value factors roughly hold their own during inflationary periods. The Value performance might be surprising to some, given that higher-duration growth stocks are often assumed to be adversely sensitive to unexpected inflation as discount rates increase. Still, a Value long/short significantly outperforms a passive long-only equity strategy. Cross sectional equity momentum performs well with real inflation regime performance of +8% on average. While the average return difference is high, we show in the paper that the difference is not statistically significant. In addition, this strategy has very high turnover.
Active trend strategies across equities, bonds, FX and commodities performed impressively. A hypothetical ‘all-asset trend’ portfolio realised a real CAGR of 25% during the US inflationary regimes.
Exhibit 2: Summary Performance of Assets in US Inflation Regimes


Source: Man Group, National Bureau of Economic Research; as of 1926-2020.
Note: A summary table of real total returns to assets analysed across this paper, through the eight US inflationary regimes shown in Exhibit 1, as well as the annualised return during inflationary, other, and all periods. In the first column, the strategy is denoted as active or passive by ‘(A)’ or ‘(P)’, respectively. Returns for energies and gold in grey italics are spot returns where we do not have futures data. These are not included in the combined regime calculation.
International Inflation
We perform a similar analysis for the UK and Japan as we have done for the US and find that equities tend to perform worst during their own country’s inflationary periods. US equities, for instance, achieve +6% and +9% real annualised return in UK and Japan inflation periods, compared to -7% in US regimes. The results also suggest benefits to international diversification. For example, taking the UK perspective, US and Japanese equities generate +6% and +9% real annualised returns during UK inflation regimes, respectively. Bonds clearly perform the worst during their own country’s inflation period.
Structural Change and the Rise of Cryptocurrencies
As with any historical analysis, we are faced with the usual question: Is this time different? For example, the inflation surge in the early 1970s was induced by an exogenous event: the OPEC oil embargo. At the time, the US economy was highly dependent on that source of oil. Today is different in that the US is not as dependent upon foreign oil sources. Moreover, while electric vehicles do not have critical mass today, such technological change in the future may make it much less likely that a surge in oil prices would have the same inflationary effect. Hence, caution needs to be exercised in interpreting the data.
There are other factors that need to be carefully weighted given the structural evolution of the US economy. In the 1950s and 1960s, the US was a manufacturing economy. Today, only 11% of GDP is driven by manufacturing. The nature of companies has changed. Much of the capital deployed is not physical but intangible, including trade secrets, proprietary software, patented and unpatented R&D, client relationships and legal rights. These may be more resilient to inflation.
Finally, we are in the midst of another technological disruption in the form of the cryptocurrencies, including bitcoin. Some have advocated the inclusion of bitcoin into a diversified portfolio as an inflation protection asset. However, caution is warranted given that bitcoin is untested with only eight years of quality data – that lack a single inflation regime. Moreover, bitcoin is more than five times more volatile than the S&P 500 or gold. This high volatility could lead to bitcoin being an unreliable hedge. In addition, there is increasing evidence that bitcoin is a speculative asset and it has a positive beta against the US market.
Conclusion
Our analysis spans nearly a century. The long sample is particularly important because inflation surges in developed economies have been rare in the past 30 years.
Some of our work reaffirms what we already know. For example, Treasury bonds do poorly when inflation surges. Commodities, often being a source of inflation, do well. However, we offer additional insights. Commodities, for example, are a diverse set of assets and the inflation hedging properties depend on the individual commodity. Most importantly, we show that historically, high and rising inflation has been very bad news for equity investors and risk parity portfolios.
Less is known about active strategies. We show that trend-following strategies have done particularly well in inflation episodes. We also find that a number of active equity factor strategies, such as a quality strategy, provides some degree of risk mitigation during inflation surges.
This has been a whistle stop tour of our findings. To find out more, please click here and select ‘Download this paper’.
You are now exiting our website
Please be aware that you are now exiting the Man Institute | Man Group website. Links to our social media pages are provided only as a reference and courtesy to our users. Man Institute | Man Group has no control over such pages, does not recommend or endorse any opinions or non-Man Institute | Man Group related information or content of such sites and makes no warranties as to their content. Man Institute | Man Group assumes no liability for non Man Institute | Man Group related information contained in social media pages. Please note that the social media sites may have different terms of use, privacy and/or security policy from Man Institute | Man Group.